[ English | Japanese ]
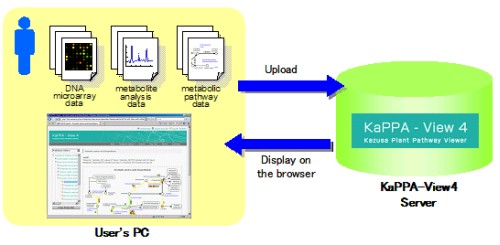
KaPPA-View is a metabolic pathway database which is aimed to better understand metabolic regulation and to generate hypotheses from huge public available 'omics' data, i.e. transcriptome, metabolome and co-expressions of the genes. KaPPA-View provides users to view gene expression data and/or metabolite accumulation data on comprehensive metabolic pathway maps. The presentation of data in this manner is useful for viewing metabolic data in a way that facilitates the discussion of gene functions.
New Features of KaPPA-View4
-
A comprehensive review of the system was conducted, and the processing speed was improved dramatically compared to the previous versions.
-
As well as Windows, Mac OS X is now fully supported and you can use all the features on it.
-
The users can use their own metabolic pathway maps for the analyses.
- As a function for the system developers, KaPPA-View4 offers features to display data directly from external systems such as databases and applications.
What can I do with KaPPA-View4?
When you upload your own DNA microarray data and/or metabolite data to the system through the web browser, KaPPA-View4 displays the fitting of data for each gene or compound on the matabolic pathway maps. By default, about 150 maps are prepared corresponding to Arabidopsis, rice, Lotus japonicus, and tomato.
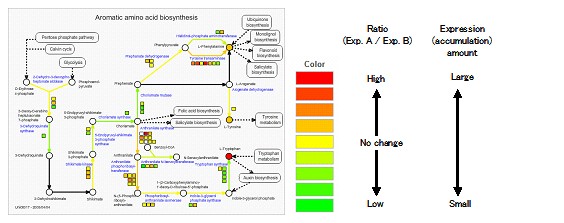
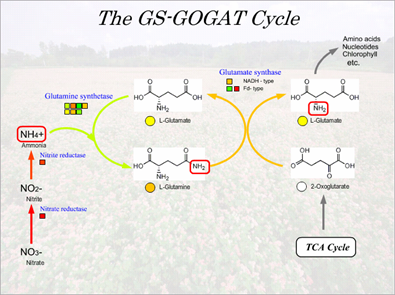
On the pathway maps, genes and compounds are represented by squares and circles respectively. The symbols are painted in different colors depending on the values such as changes in the ratio between two experiments and the amounts detected in one experiment.
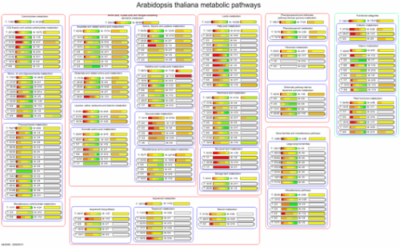
On the "Bird's-Eye View Maps", you can view the summarized values for all maps and find out the pathways which have changed considerably.
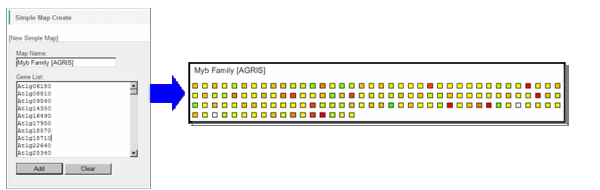
Non-metabolic genes which do not exist on the maps - such as transcription factors - can be analyzed. By entering the gene IDs, you can create simplified maps.
In addition, the users can also use the pathway maps prepared by themselves.
Up to four maps can be viewed at once in a single browser window.
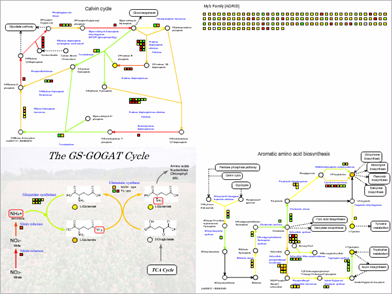
Furthermore, gene-to-gene and/or metabolite-to-metabolite relationships such as co-expression correlations of genes can be displayed on the maps. This is the distinctive feature of KaPPA-View and will help you, for example, to analyze the relationships between metabolic genes and transcription factors that control them.
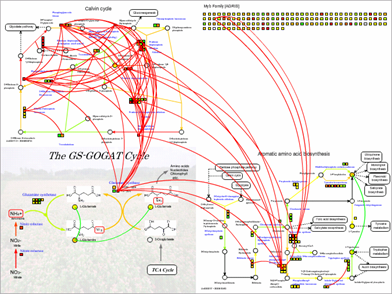
KaPPA-View4 can handle multiple species, and genes of several species can be displayed side by side on the maps. The system also provides functions to upload and view the omics data from external applications.